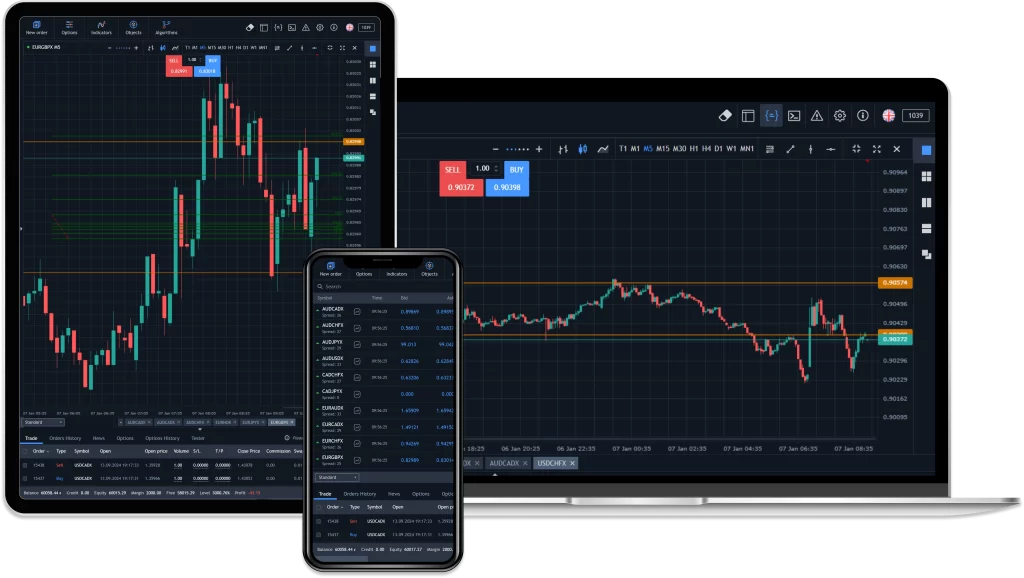
Advanced Charting
Enhance analysis with versatile chart options on our trading platform, including candlestick, line, and bar charts. These options provide a clear dissection of price trends and patterns across different time frames, allowing better decision-making.

Timeframes
Choose from a spectrum of time frames: 1 minute, 5 minutes, hourly, daily, weekly, or monthly. Users can tailor their strategies, trading styles, and analysis to match their specific goals and market conditions.

Technical Indicators
Our cutting-edge trading software provides a wide range of technical indicators, including moving averages, Relative Strength Index (RSI), Moving Average Convergence Divergence (MACD), Stochastic Oscillators, Bollinger Bands, and many others.

Drawing Tools
Charting tools enable drawing trend lines, identifying support and resistance levels, and conducting visual analyses to improve trading outcomes.